Start date: 15-01-2022
End date: 15-06-2022
Clinical problem
Orthostatic hypotension (OH) is a common condition among the elderly and is related to a prolonged and/or deep blood pressure (BP) drop upon standing up. A BP drop is natural when standing up, caused by gravity-induced venous pooling in the legs. Feedback mechanisms in the body force BP to recover. But with patients diagnosed with OH this recovery is slow and can cause dizziness and lightheadedness which may cause falls. The OH diagnoses are currently based on a one-time measurement, taken at the hospital. This is then only a snapshot and could be affected by for example the white coat syndrome. This is why there is a need for a home monitoring system, then patients can measure their BP throughout the day and give us more reliable data. This can be used by experts to see if a patient suffers from OH. The Finapress is the device used to get continuous BP readings, this is a movement-restricting device and is clipped to the finger. This device is not fit for long-term use since it restricts the blood flow in the finger and especially in the elderly, this might cause wrong measurements because of a lack of blood pressure. Here the lightweight Near-Infrared Spectroscopy (NIRS) devices can be used, this technique can detect changes in oxygenated and deoxygenated haemoglobin in the brain. These changes in cerebral haemoglobin concentration to a large extent depend on the cerebral blood flow. Making it a candidate method of continuously measuring BP. The NIRS measurements can then be used to estimate what happens to the BP after a person stands up. The most important values used by the experts are: - BP recovery at certain moments in time: - Most often used 30-60/50-60 seconds after standing up. - 60-120/60-180 s after standing up: indicative of OH. When the drop is sustained at >20/10 mmHg, it is OH. - Initial drop: the minimum after standing up (reached within 30 seconds). - Initial drop rate.
In this project, the goal is to estimate these parameters based on the NIRS values. Allowing experts to easily make a diagnosis for OH.
Data
The data consist of 41 subjects who in turn performed two challenges. One challenge makes people stand up fast after being supine and the other challenge makes people stand up quickly after sitting down. In one challenge the following procedure is repeated 3 times. - Start 5 minutes baseline (sitting/ supine). - Start standing up, and the participant starts moving in response to a cue. - End standing up, the participant is fully standing. - Stop, after 3 minutes of standing.
The BP and NIRS signals are simultaneously measured during the challenge. Due to the lack of data for each subject, 6 drops for each individual, the available data are grouped. Leaving us with 246 BP drops with the corresponding oxygenated and deoxygenated haemoglobin values.
Method
For this project, an algorithm is created which will forecast the previously mentioned parameters based on input oxygenated and deoxygenated haemoglobin values. Since the oxygenated (oxy) and deoxygenated (dxy) haemoglobin are very noisy, first Butterworth smoothing is applied. The NIRS values are measured at 100Hz and the BP is measured at 200Hz, these frequencies are very high and not clinically relevant. This will be set to 1HZ to make it less computationally expensive. The oxy and dxy are converted from 100hz to 1hz by using a rolling window. From this rolling window, we extract the mean, standard deviation, minimum and maximum within the window. These values are our input values and will be fed into the algorithm to estimate the BP parameters. This will contain 40 seconds of baseline (sitting/supine) data and 150 seconds of standing data. From the provided BP signal (in mmHg) the systolic and diastolic BP is extracted by taking the peaks and troughs. For both the systolic and the diastolic data the wanted parameters are extracted and these will be our target values. This will be the difference from the baseline; the drop is the minimum within 30 seconds after standing up minus the baseline.
Results
From these parameters, we can recreate the BP drop and this will allow us to give a visual representation of what happens with the BP after standing up. The model estimates the parameters and these parameters are all based on the baseline. This baseline is the mean of a window between 40 and 10 seconds before standing up. In the figure below we can see an example of the reconstruction, this is based on the actual target values and not yet an estimation. The goal is to make this reconstruction based on a prediction by the algorithm given the NIRS values. A pipeline is created which will perform optimization and fitting on the data, this pipeline experiments with different models and will report back the best performing model.
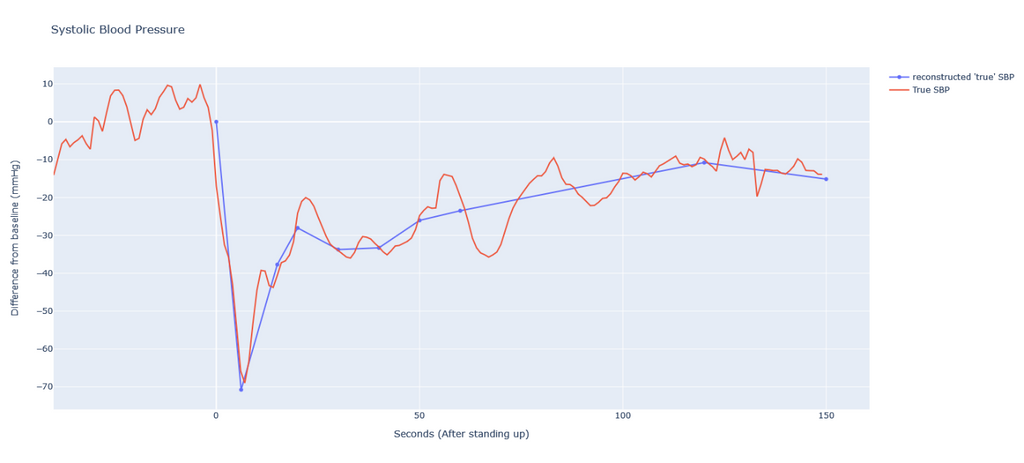
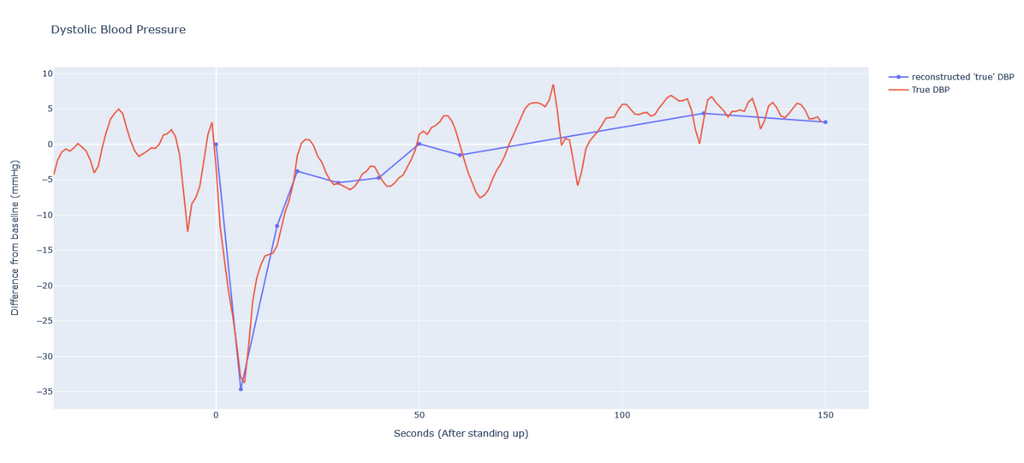
Figure: Example of the reconstruction based on extracted parameters
For this reconstruction, we use the minimum value between 30 seconds as standing up as the drop and recovery after 15, 20, 30, 40, 50, 60, 120 and 150 seconds. The baseline is extracted from the values, centring the plot around 0. In the end, the parameters will be visualized together with this reconstruction such that the expert can make his/her diagnosis with ease.
Unfortunately, the results are not as equally promising as in the example. Some estimations are incorrect and far from the true parameters.
Conclusion
Although some of the predicted BP drop parameters allowed for a good reconstruction of the SBP and DBP, not all drops were successfully predicted. This is due to the low amount of data available and the prediction could be improved by training the algorithm on more data. With more training data this method might prove to be a good alternative to diagnosing OH.
The code for this project can be found in this GitHub repository.
For the thesis: click here.


