Start date: 01-03-2020
End date: 31-08-2020
Clinical problem
Body composition is an important biomarker in the treatment of cancer. In particular, low muscle mass has been associated with higher chemotherapy toxicity, shorter time to tumor progression, poorer surgical outcomes, impaired functional status, and shorter survival. However, because CT-based body composition assessment requires outlining the different tissues in the image, which is time-consuming, its practical value is currently limited. The different tissue types are often outlined manually and only in a single slice of a CT scan at the level of the third vertebra (L3). This is based on the observed linear relation between cross-sectional areas and total body volume of muscle and fat. However, 2D estimates are still less accurate than 3D measurements. For use in both routine care and in research studies, automatic segmentation of the different tissue types is desirable, especially if that would enable quantification of various tissue types in the whole 3D scan rather than a single slice.
Innovation
The goal is to develop a deep learning algorithm that automatically outlines different muscles and fat in 3D CT scans. An important aspect of this project is also the implementation as an easy to use web-app so that the software can be used by clinical researchers.
Results
We developed a deep neural network which accurately segments skeletal muscle (SM), inter-muscular adipose tissue (IMAT), visceral adipose tissue (VAT), and subcutaneous adipose tissue (SAT) in the abdomen. The goal of this research project was to achieve state-of-the-art results for body composition assessment using routine CT scans of the abdomen. The proposed method gives a more accurate assessment of body composition than related work with the same objective.
The algorithm achieves dice scores of 0.91, 0.84, 0.97 and 0.97 for SM, IMAT, VAT, and SAT respectively, with an average of 0.92.
The mean percentage differences between the predicted area quantification and ground truth are 8.83%, 11.5%, 3.47%, and 1.08% for SM, IMAT, VAT, and SAT respectively.
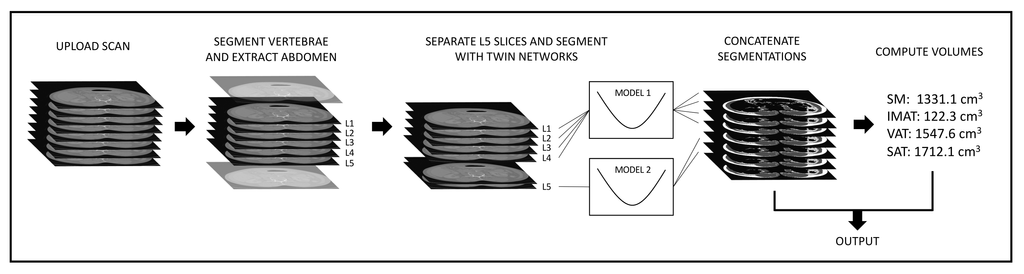
Flowchart of the application, as it is hosted on grand-challenge.
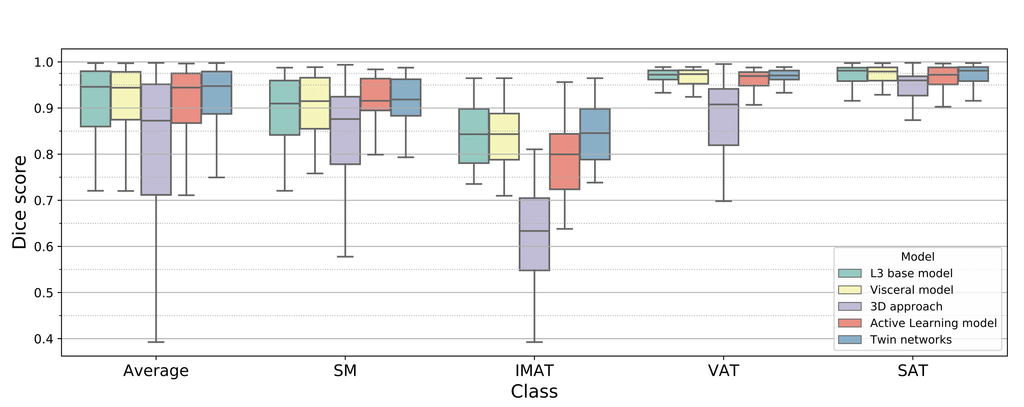
Box plots showing the dice score (averaged over all locations in the abdomen) for each class and each experiment model. The final proposed model is the Twin networks approach.
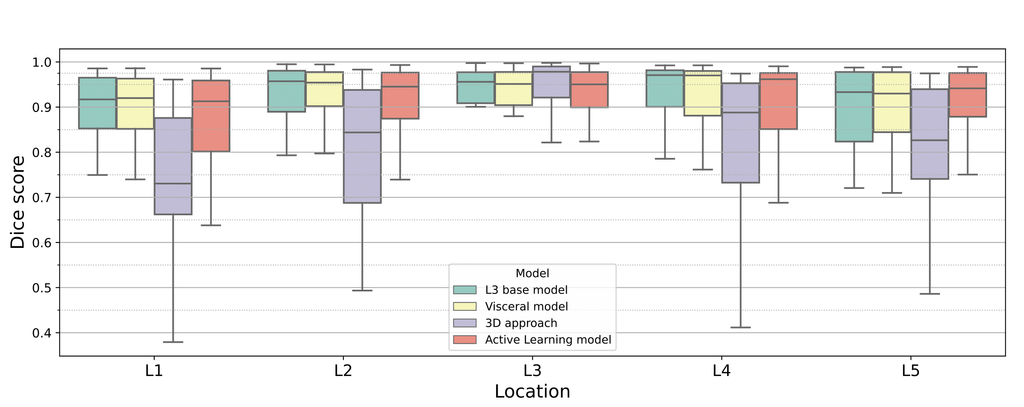
Box plots showing the dice score (averaged over all classes) in each location in the abdomen, for each model. Note that the box plot for the twin networks is not shown in this figure since it is equivalent to the performance of the L3 base model for L1 - L4, and the active learning model at L5.
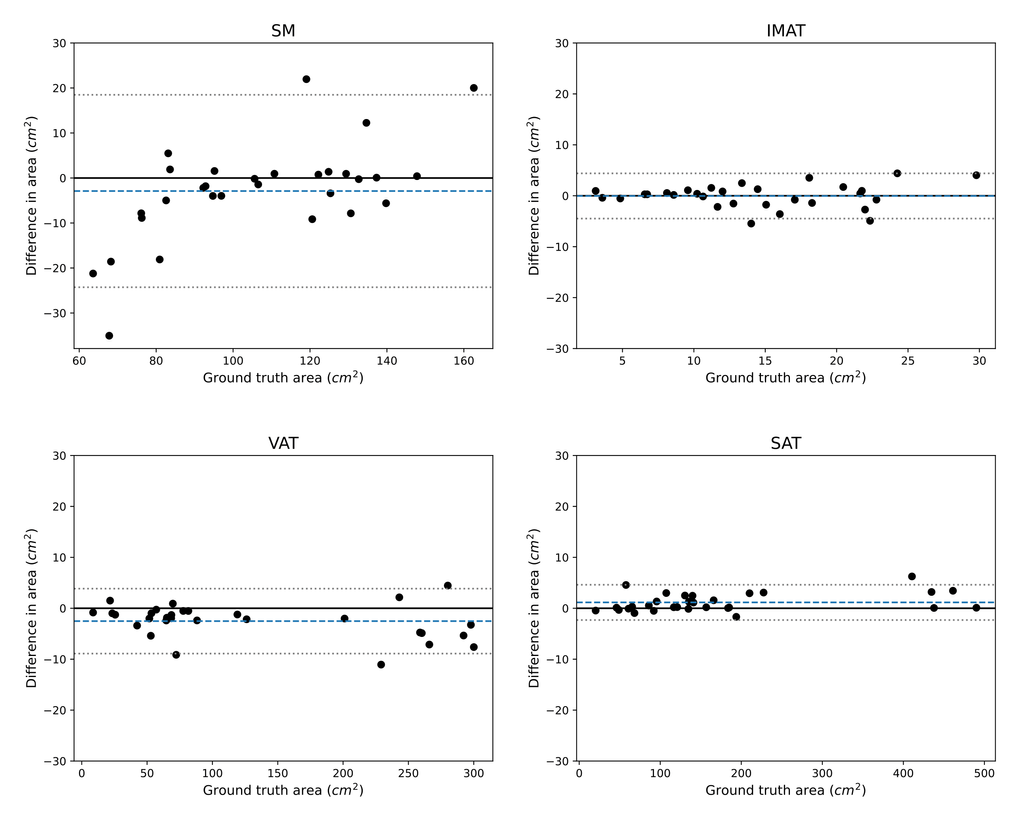
Bland-Altman plots showing the difference in area for each class between the predicted quantification and the ground truth in cm^2. The predictions are those of the twin networks approach. The 30 data points are the test slices, 6 for each location in the abdomen (L1 - L5). The mean difference is indicated by the dashed blue line. The 95% confidence intervals are indicated by the gray dotted lines.
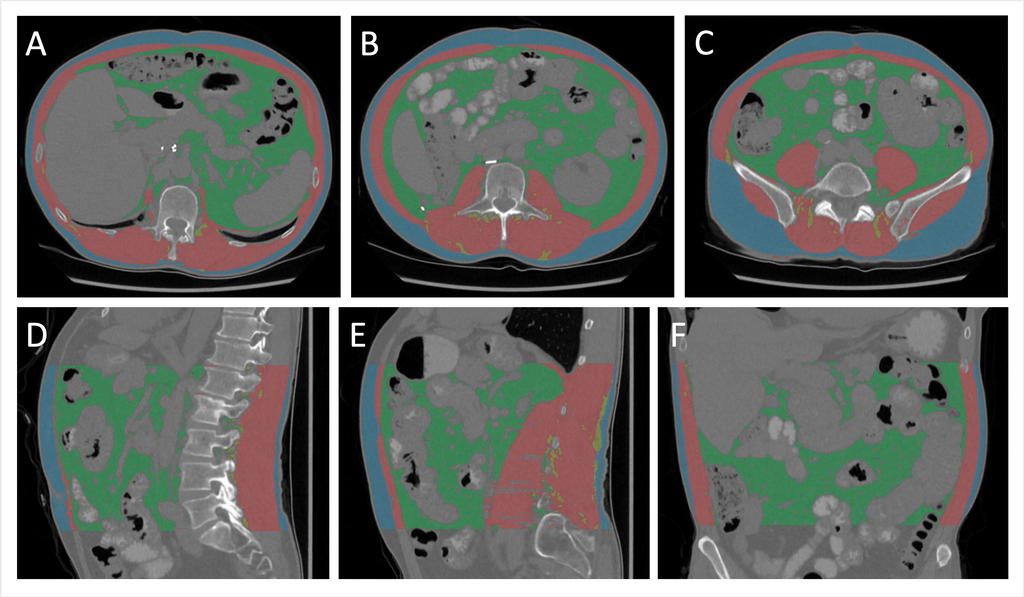
Representative example of abdominal segmentation of muscle and fat. A-C: axial slices at L1, L3, and L5. D, E: sagittal slices through the middle and to the left of the body. F: coronal slice through the center of the abdomen.
An interactive demo is accessible via Grand-Challenge:
The code for this project can be found in this GitHub repository.
The final report for this project can be found here.