Start date: 10-01-2022
End date: 30-06-2022
Clinical problem
The tumor microenvironment consists of a collection of different immune cells that congregate around cancer cells. The lymphocytes influence tumor progression by either inducing cell death or inhibiting immune response. It is hypothesized that they could be used as a biomarker to gauge prognosis and survival in patiënt undergoing immunotherapy.
Quantifying the amount of lymphocytes in the environment of a tumor is a time consuming task which needs to be done by a trained pathologist and is subject to a lot of inter and intra observer variability. There is no standardized methodology to recognize spatial patterns or interactions between lymphocytes by hand. If automated, research into tumor infiltrating lymphocytes could be done much more quickly and consistently.
Tissue samples on slides need to be stained before they can be histologically examined using light microscopy and digitized. There is a large variety of immunohistochemical stains to differentiate different lymphocytes by membrane proteins as well as scanners to digitize slides. The ideal model would be able to differentiate lymphocytes in slides of all types of immunohistochemical staining and scanning.
Methodology
The goal of this project was to generalize an existing model that was able to detect lymphocytes in CD3 and CD8 stained slides of prostate cancer, to other types of immunohistochemical staining.
First smaller patches were randomly extracted from the regions of interest in the training and validation WSI’s. For the training patches, the following augmentations were used: Flipping, Cutout, compression, randomisation of contras or gamma limit and color augmentations. These patches were then used to train a Unet segmentation model with an efficientnet-b0 encoder pre-trained on imagenet, using base cross entropy loss.
To quantify the lymphocytes in the data, inference needs to be performed on the images. During inference, the WSI is divided into tiles which are separately analyzed by the model. Then reassembled to provide a mask containing soft-max predictions. These predictions are then postprocessed.
Results
To evaluate the performance of the model, the distance between manually annotated coordinates and the coordinate of the top most pixel of the detected area is measured. If this was less than 2 pixels the detection is considered a true positive. This method was used to generate a confusion matrix and FROC analysis.
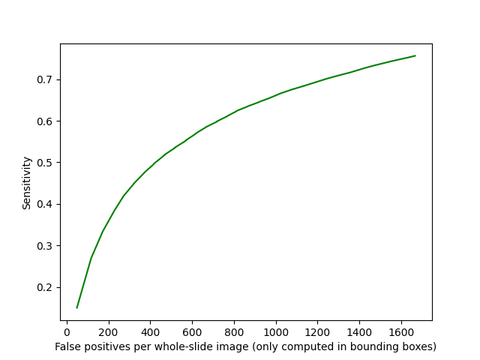
FROC curve of the U-Net model developed in this project.
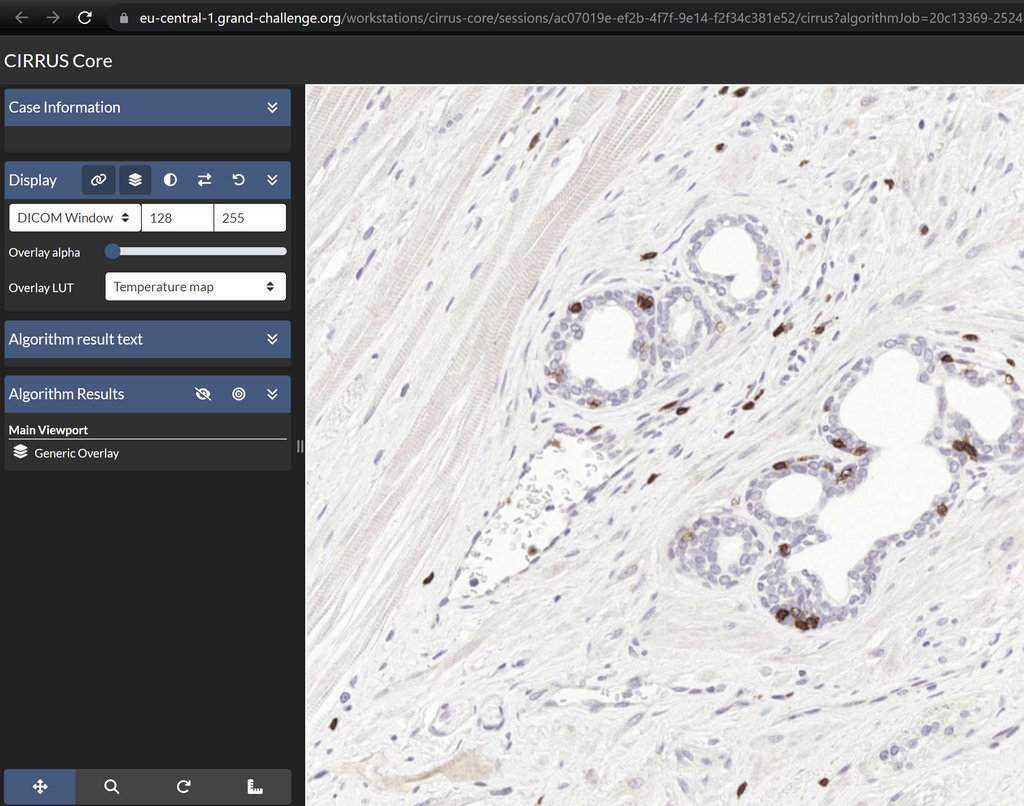
Screenshot of the web application visualizing an IHC slide.
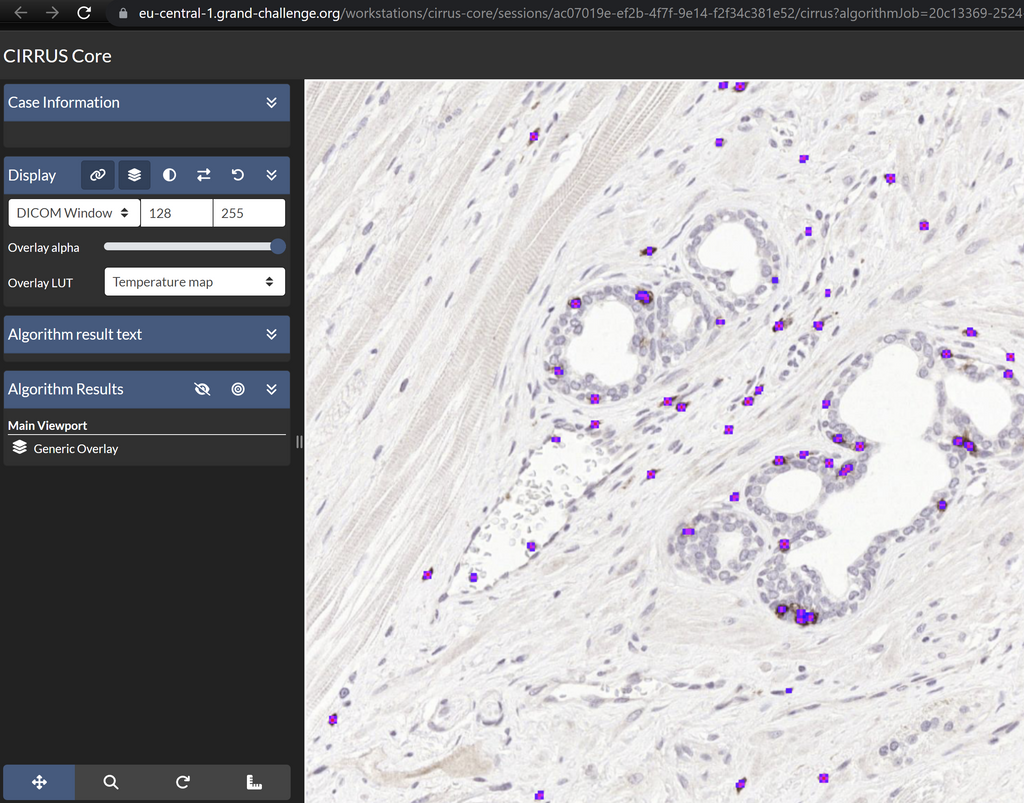
Screenshot of the web application visualizing an IHC slide with detected lymphocytes overlayed.
The web application developed in this project based on grand-challenge can be found here: