Start date: 18-08-2020
End date: 18-02-2021
Clinical Problem
Bradykinesia is one of the cardinal symptoms of Parkinson’s disease (PD). Bradykinesia is defined as a slowness to initiate a movement, with a progressive reduction in speed and amplitude. This decrease in amplitude or speed, also known as the sequence effect, is often seen while performing repetitive movements. The management of bradykinesia is determined by clinical evaluation using standardized clinical assessments, i.e. the MDS-UPDRS. However, the reliability of those assessments usually falls short. In general, the problem lays in the large inter-rater variability. In the case of bradykinesia, symptoms as sequence effect, akinesia and freezing are all condensed in one score, making it harder to standardize the rating process. In addition, the use of standardized scales requires an in-person clinical examination, which includes burdensome travel time for patients and provides only a partial representation (i.e. one time-point assessment) of the overall disease impairment.
Solution
Objective assessments, such as the online keyboard test or the analysis of someone’s typing behaviour, may address the limitations in clinical evaluation by diminishing the inter-rate variability and allowing the detection of small variations due to long-term monitoring. We expect that the analysis of the online keyboard test data and the typing behaviour data of participants using robust data analysis techniques may reveal patterns that can be used to estimate bradykinesia in a more reliable and standardized manner. In the course of the project, a second test using wearable sensors around the wrists was also investigated which is closer to one of the tests during the clinical assessment.
Data
Data from 20 people with PD, 19 people with Cerebellar Ataxia and 20 healthy controls was collected. The PD patients performed all tests both with and without medication. Since the keyboard test is not able to capture information about the amplitude, we investigated wearable sensor
Dataset 1: Keyboard Test Data
Each of the participants performed a keyboard test composed of 3 tasks: * M-test: Repetitively tap the key "m" as fast as possible * MN-test: Alternate between tapping the keys "m" and "n" as fast as possible * QP-test: Alternate between tapping the keys "q" and "p" (distance approximately 15cm) as fast as possible
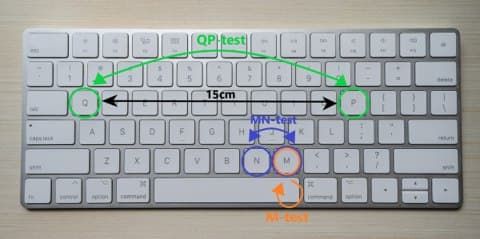
Each of those tasks was performed for 60 seconds with each hand and all keystroke times recorded. Using the keystroke times, we extracted: (1) the dwell times (DT) - time a key is pressed, (2) the flight times (FT) - time the finger is above the key, and (3) possible errors. Flight and dwell time outliers (>2SD) are rejected. All features were extracted for the flight times and dwell times for all three tests separately.
Dataset 2: Wearable Sensor Data
Each of the participants performed pronation-supination movements with each arm for at least 10 seconds. The wearable sensors (Physilog 5) around the wrists recorded the angular velocity along the x-, y-, and z-axis. We used the signal along the y-axis that captures the pronation-supination movements.
Research Questions
The aims of this study are:
(1) to identify patterns in the datasets that can detect the presence of sequence effect in people with PD;
(2) determine which outcomes derived from typing and clinical data can be used in a discriminant model to classify the MDS-UPDRS score;
(2) determine which outcomes derived from typing and clinical data can be used in a discriminant model to classify disease status (PD vs CA vs HC).
Approach
A set of features were manually extracted from each of the datasets. They are normalized with a MinMax scaler. The features are based on the MDS-UPDRS upper limb bradykinesia assessment criteria: speed, amplitude, hesitations, halts, and decrementing amplitude. Due to the relatively small datasets, we decided to train and evaluate multiple relatively simple machine learning models (decision trees, support vector machines, logistic regressions, ordinal logistic regressions, linear regression, random forest classifiers, multi-layer perceptrons, and k-neighbours classifier). In addition, we then applied ensemble learning methods, such as boosting and stacking to improve performance. The performance of the models was validated with 10-fold stratified cross-validation. We use the mean absolute error as an evaluation metric when predicting the MDS-UPDRS score and balanced accuracy when predicting the diagnosis. Additionally, we also created confusion matrices to visualize which classes (diagnoses or MDS-UPDRS scores) were easier or harder to distinguish.
Results
For each dataset different features were extracted that are intended to capture bradykinesia.
Extracted Features
Keyboard Test
In total, we selected 10 features based on correlation from the keyboard test data:
| Feature Description | Keyboard test | FT/DT | Correlation with MDS-UPDRS | |
|---|---|---|---|---|
| 1. | Sequence effect with recovery | MN-test | FT | 0.39 |
| 2. | Kinesia score | MN-test | - | -0.6 |
| 3. | Slope of fitted linear regression line | MN-test | FT | -0.095 |
| 4. | Standard error of fitted linear regression line | QP-test | DT | 0.64 |
| 5. | Number of errors | QP-test | - | -0.11 |
| 6. | Typist information | - | - | -0.13 |
| 7. | Hesitations | QP-test | DT | -0.39 |
| 8. | Incoordination score | MN-test | - | 0.4 |
| 9. | Akinesia time | M-test | - | 0.5 |
| 10. | Dysmetria score | M-test | - | 0.15 |
They are a combination of features based on dwell or flight times from all three tests (M, MN, QP).
Wearable Sensor Test
In total, we extracted 10 features from the wearable test data based on the MDS-UPDRS criteria:
| Feature Description | Correlation with MDS-UPDRS | |
|---|---|---|
| 1. | Mean amplitude | -0.13 |
| 2. | Variance amplitude | -0.25 |
| 3. | Slope/Decrement Amplitude | -0.025 |
| 4. | Main frequency | -0.51 |
| 5. | Variance in movement periods | 0.24 |
| 6. | Slope/Decrement of periods | -0.14 |
| 7. | Number of movements | -0.52 |
| 8. | Hesitations | 0.13 |
| 9. | Halts | -0.097 |
| 10. | Frequency characteristic | -0.41 |
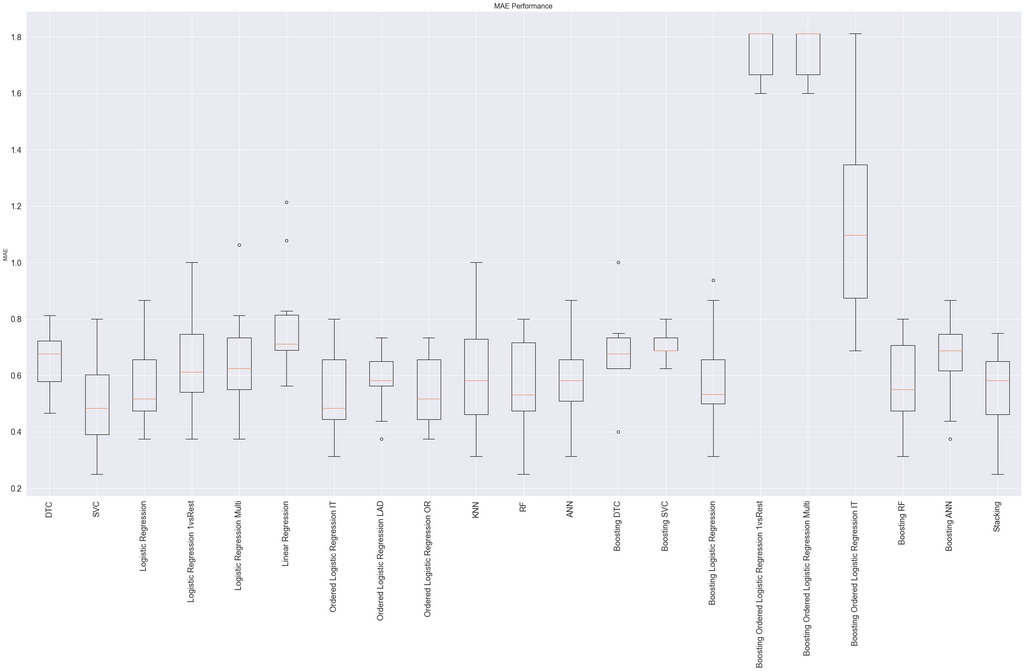
Model Selection
For both tests, we evaluated the previously mentioned models alone and in combination with the ensemble methods. We chose two different best-performing models for each dataset, i.e. (1) for predicting the MDS-UPDRS score and (2) to predict the diagnosis.
Keyboard Test
All models show a lot of variance in performance based on the train/test split of the 10-fold cross-validation. Several models of the best-performing models show no significant difference in performance. When this was the case, we chose the model that seemed more sensible for the type of data.
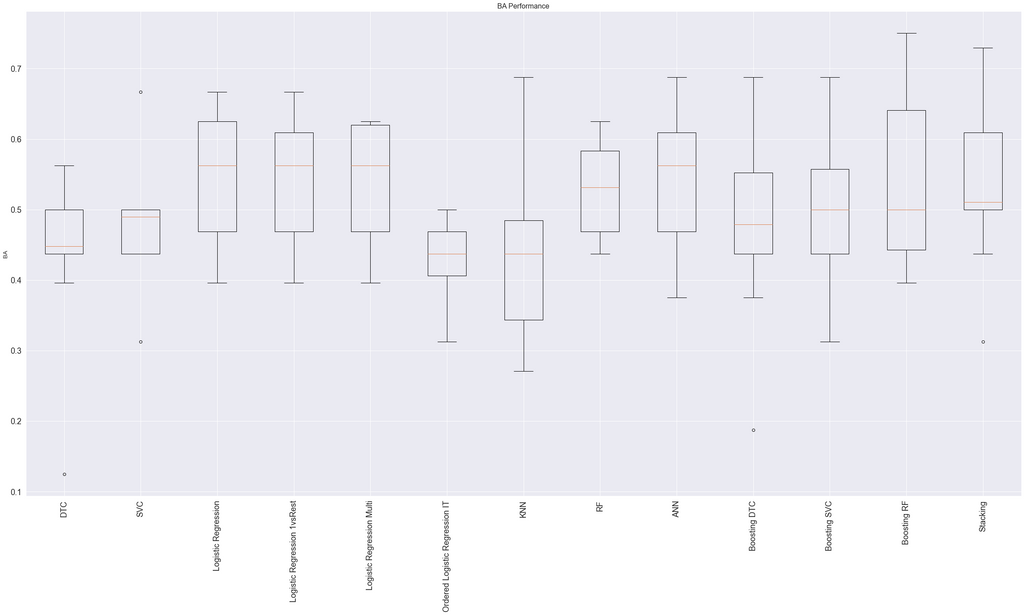
We chose the ordinal logistic model (using the mord library) as the best model for predicting the MDS-UPDRS since it performed as one of the best models and captures the ordinal characteristic of the MDS-UPDRS scores.
For predicting the diagnosis, we chose Adaboost classifier with random forest classifiers as the base estimators (using the sklearn library).
Wearable Sensor Test
All models show a lot of variance in performance based on the train/test split of the 10-fold cross-validation for this dataset as well.
We chose the Adaboost classifier with random forest classifiers as the base estimators (using the sklearn library) as the best model for predicting the MDS-UPDRS. Several other models, including only random forest classifiers, performed similarly.
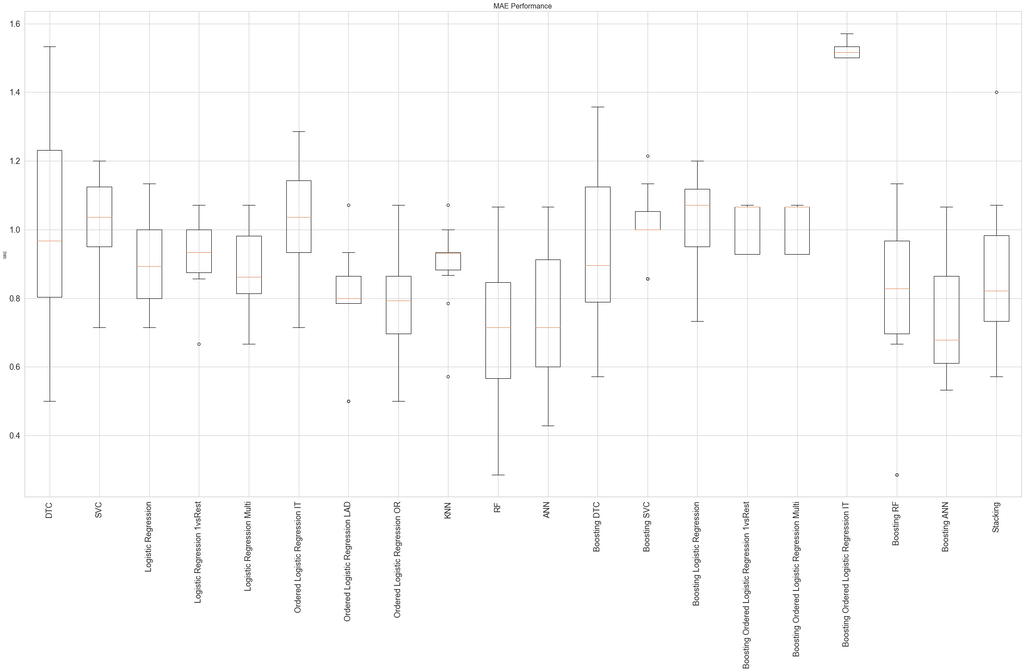
For predicting the diagnosis, we also chose Adaboost classifier with random forest classifiers as the base estimators.
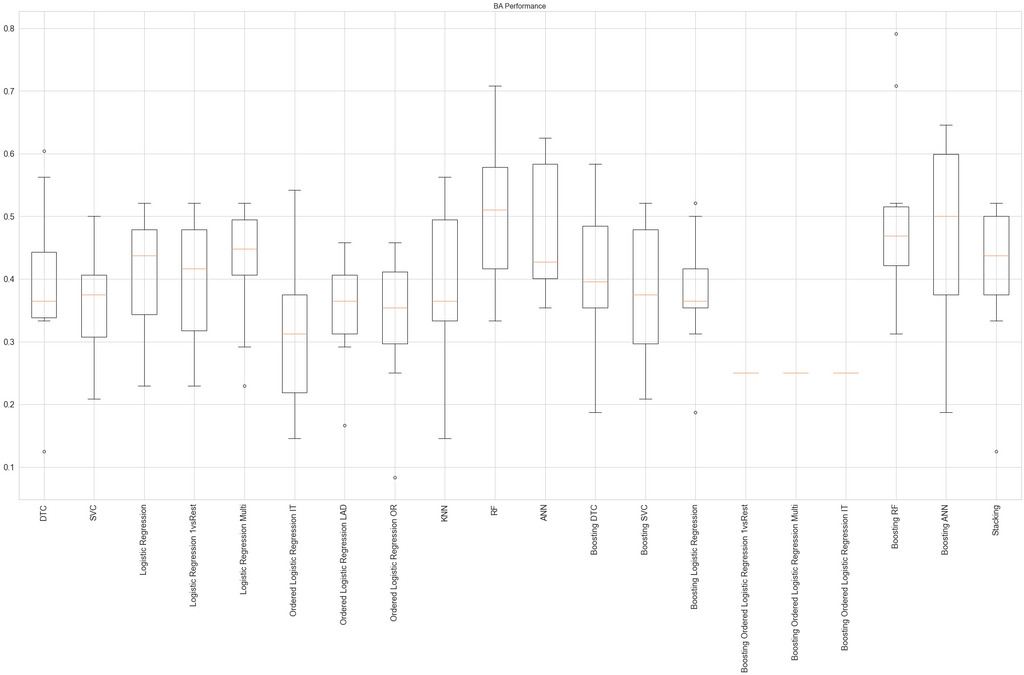
Model Performance
Diagnosis Prediction
The table shows the balanced accuracy of the best-performing models for each dataset. All models show a high variation in performance depending on the train/test split.
| Keyboard Test | Wearable Sensor Test | |
|---|---|---|
| PD off vs HC | 88.33% (±8.9%) | 80.0% (±15.0%) |
| PD off vs PD on | 54.58% (±19.41) | 58.75% (±16.29%) |
| PD off vs HC vs CA | 73.06% (±14.49%) | 63.61% (±11.14%) |
For both datasets, the best-performing models were relatively successful at distinguishing between PD patients off medication and healthy controls. The keyboard test model achieved a balanced accuracy of 88.33%. The wearable sensor test model achieves a balanced accuracy of 80%. However, both models were barely able to distinguish between PD patients on medication and PD patients off medication. They both perform barely better than the baseline (50%) on average. In contrast, the models achieved a relatively good performance when predicting PD, CA, or HC. Both models could distinguish quite well between HC and PD/CA. They did, however, struggle to distinguish PD from CA.
MDS-UPDRS Prediction
The table shows the mean absolute error for the best-performing models for each dataset.
| Keyboard Test | Wearable Sensor Test | |
|---|---|---|
| MDS-UPDRS | 0.51 (±0.10) | 0.73 (±0.24) |
The keyboard test model performs slightly better than the wearable sensor model with a mean absolute error of 0.51 on average. Hence, each MDS-UPDRS score assigned by this model is on average ±0.51 off the score assigned by the clinician.
Detecting the Sequence Effect
One aim of this project was to find features that capture the sequence effect, i.e. the progressive reduction in speed and amplitude. We tried capturing this decrement with the slope of a fitted linear regression line. However, we were not able to find a decrement in speed in both datasets. There was also no clear decrement in the amplitude detected during the pronation-supination movements.
Conclusion
The extracted features seem to capture bradykinesia well in that the trained model is good at distinguishing between PD patients and healthy controls. Unfortunately, the models do not seem to be good at distinguishing PD patients off medication from both CA patients and PD patients on medication. The models also seem to have trouble to differentiate between the different severity scores of bradykinesia. The sequence effect was not detected. Instead, we observed that the cadence of the tapping/movements seems to be more relevant for the predictions.
Discussion
A general trend within this project was the large variation within and between the different groups of participants for almost all features as well as in the performance of the models. While both tests seem to capture bradykinesia to a certain extent, the results do not indicate that either of the tests would be a good solution for long-term monitoring. Other objective at-home tests with available technology that are currently being researched show more merit due to being less invasive (e.g. recording typing behaviour in the background) and hence require less effort and compliance. For all future studies, it is recommended to collect much more data, possibly over a longer period of time, to enable the use of more sophisticated AI techniques and a better evaluation of long-term monitoring.
The code for this project and the final report can be found in this GitHub repository.


